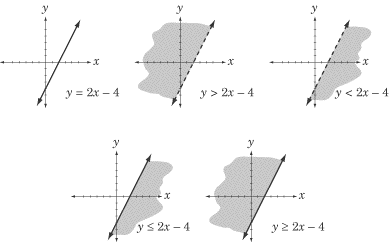
请同学们仔细看下面的例子:
The graph of an inequality is a graph of a region rather than a simple graph of a line. An inequality is actually the graph of all the points on the coordinate plane that are either greater or less than a particular line. For this reason, the graph of an inequality looks similar to the graph of a line but has two major differences. First, the region on one side of the line (which side depends on the inequality) is shaded. Second, the line itself is either dotted or solid depending on whether the inequality is inclusive.

To summarize the above graphs: when the inequality is “greater than or equal to” or “less than or equal to,” the line in the graph is solid; when the inequality is “greater than” or “less than,” the line in the graph is dotted. Any point that satisfies the inequality lies in the shaded region, and any point that does not lies in the un-shaded region.That’s all you need to know about graphing inequalities for the Math IC.
-
SAT数学取得高分的九大答题原则
与SAT其他部分相比,数学部分拿高分对我们中国学生来说并非难事,但同学们不能因此轻视,还是要总结方法争取拿满分,小编分享给大家九大答题原则。希望对考生有所帮助。
- SAT考试数学基础词汇大全
- 新SAT数学首考动向解析
- 新SAT数学考试趋势和难点解析
- SAT数学的难度如何?


